Experiments #2 and #3: Crash a node, kill the database
Closing out Phase 1 meant answering two uncomfortable questions: does a crash show up anywhere except a scrolling terminal? And what happens to telemetry when Elasticsearch dies? We broke things on purpose to find out, and the breakage found three bugs we didn't plan for.
New tools for breaking things
- Fault injection.
battery_simhas afault_crash_after_sparameter:make battery-run FAULT=60crashes it at 60 s. - Launch-level telemetry. A crashed node can't report its own death, but
ros2 launchwatches every process.process_exit_telemetry()turns each unexpected exit into aprocess_exitevent. - Two new analysis checks. Data completeness (no gaps longer than 3 s) and no unexpected process exits.
- A launch_testing integration test that starts the real nodes and asserts on the events, including the injected crash. There are now 15 tests.
- MCAP replay.
make replay RUN_ID=...rebuilds a run in Elasticsearch from its bag, 10× faster, on simulated time. The replay of Experiment #1 reproduced the drain rate (0.1%) and the transitions exactly.
Experiment #2: crash battery_sim at 60 s
| Drain rate (fraction/min) | 0.5000 | 0.4982 (0.4% off) | PASS |
| Unexpected process exits  | 0      | 1 (battery_sim-1 rc=1) | FAIL |
The crash went from the process, to launch, to a ROS event, to Elasticsearch, to the analysis and the Kibana "Process exits" panel. It took three attempts:
- Attempt 1 crashed for the wrong reason.
FAULT=60reached the node as the integer 60, and the parameter was declared as a double:InvalidParameterTypeExceptionat startup. Launch arguments are parsed as YAML, so60 ≠ 60.0. Now there's adeclare_float()helper that accepts both. - Our crash reporter made launch hang. Publishing from launch's ROS node during shutdown raised
cannot use Destroyable because destruction was requestedand, in one run, apparently leftros2 launchhung for 24 minutes after every process had exited. (We fixed the cause before reproducing the hang, so that link is our best reading, not proven.) Now exits are only reported while the system is running (those are the crashes), the reporter can never raise into launch, and every automated launch has a hardtimeout -k 20deadline. - The shipper crashed while shutting down, because it read the ROS clock after ROS had shut down. It now falls back to wall time for its final stats.
Experiment #3: stop Elasticsearch for 55 seconds mid-run
final stats: received 157, shipped 157, dropped 0, rejected 0, es_unavailable 68
Zero data lost. The shipper failed 68 flush attempts, buffered everything in memory, and drained the backlog the moment Elasticsearch came back. The robot side never noticed.
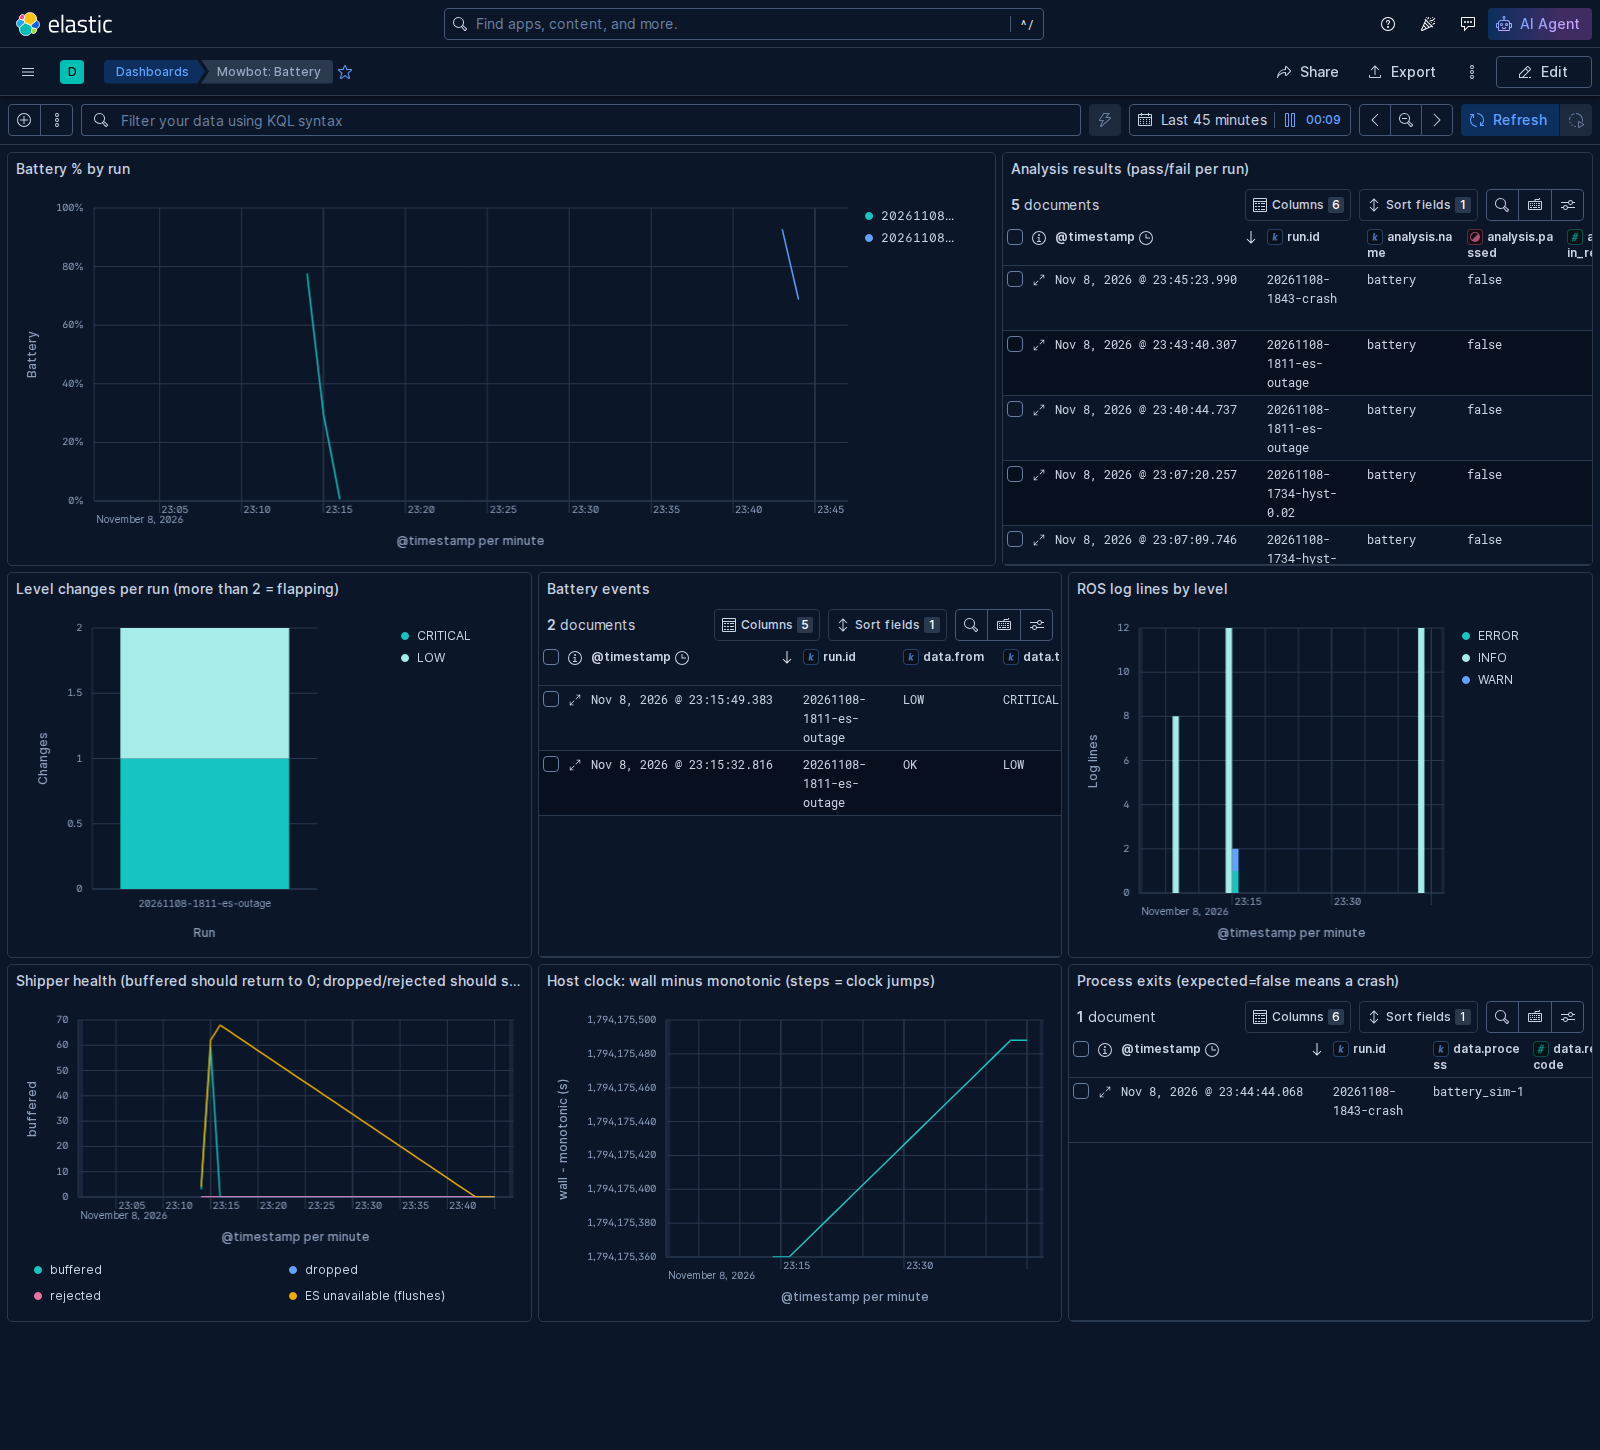
The new bottom row tells the whole story:
- Shipper health (bottom left):
bufferedjumps to about 60 during the outage and returns to 0.droppedandrejectedstay at 0. - Host clock (bottom middle): wall minus monotonic climbs about 130 s in 30 minutes. That's the clock that lied, now permanently on the dashboard.
- Process exits (bottom right): the injected crash, with
expected=false.
Both runs still fail data completeness, and that's honest: every gap lines up with the host clock's +2.9 s steps (we checked the outage window gap by gap against the MCAP bag). Until the clocksource is fixed, this machine's timestamps can't be trusted, and the analysis says so.
Lessons learned
- Chaos experiments test the observability, not just the system. Our first crash test mostly proved that our crash reporting had bugs.
- Shutdown paths are where telemetry code goes to die. Three of today's bugs lived there.
- Every automated process needs a deadline. A hang that a human would notice in 5 seconds blocked an agent for 24 minutes.
- Buffer, count, and prove it.
received == shippedwithdropped == 0is a claim the dashboard can check.