Experiment #1: Does hysteresis stop flapping?
Our first real experiment, run the way all of them will be: change one parameter, tag each run with a run_id, and let the analysis and dashboard decide.
The question
The battery monitor sorts readings into OK, LOW and CRITICAL. Real batteries are noisy (our sim adds ±0.5% Gaussian noise), so when the true level sits right at a threshold, a naive classifier bounces between levels. A mower that flips between "go home" and "keep mowing" is a mower that twitches in the middle of the lawn.
The textbook fix is hysteresis: worsen immediately, but only recover after passing the threshold plus a margin. We built it with a 2% margin. Does it actually matter?
The setup
Two identical 4.5-minute runs, back to back, with the same random seed. Only one parameter changed:
make battery-run RUN_ID=20261108-1734-hyst-0.02 HYST=0.02   # A: as designed
make battery-run RUN_ID=20261108-1734-hyst-0.00 HYST=0.0    # B: control
Results
| Run | Measured drain vs. configured | Level transitions | Verdict |
|---|---|---|---|
| A: hysteresis 0.02 | 0.2501 vs 0.2500 (0.0% off) | OK → LOW → CRITICAL | ✅ PASS |
| B: hysteresis 0 | 0.2501 vs 0.2500 (0.0% off) | OK → LOW → OK → LOW → CRITICAL → LOW → CRITICAL → LOW → CRITICAL | ❌ FAIL |
Without hysteresis the monitor changed its mind 8 times instead of 2. The flaps came in bursts within about 3 seconds of each threshold crossing (22:43:00.9, 01.9, 03.4, 03.9): exactly the window where the noise is bigger than the true drain per tick.
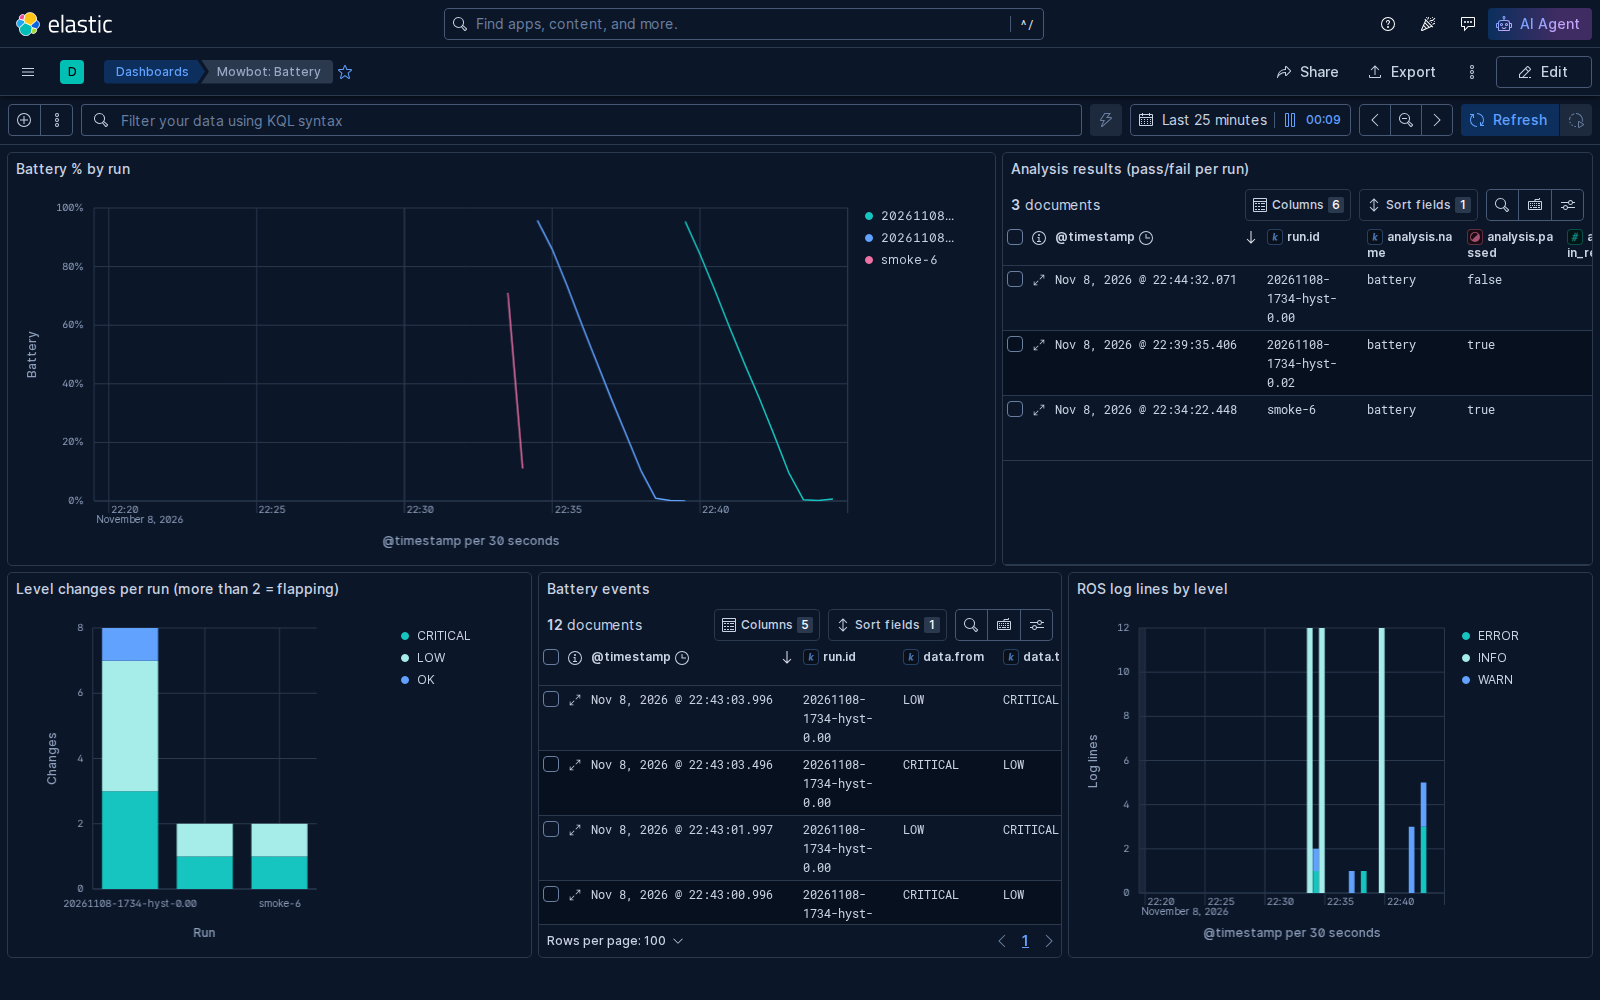
Reading the dashboard:
- Battery % by run (top left): all runs drain in clean straight lines. The drain-rate fix from Phase 1 holds at 0.0% error.
- Level changes per run (bottom left): the hysteresis-0 bar towers at 8. That chart was designed for exactly this question, before we had the data.
- Analysis results (top right): the pass/fail verdicts written back into Elasticsearch by
analysis/battery_report.py. - ROS log lines by level (bottom right): the WARN and ERROR spikes are the flaps, logged as they happened.
Why this matters for a lawnmower
Every threshold decision the mower makes later works the same way: "battery low, go dock", "obstacle close, stop the blade", "GPS fix lost, slow down". Each will get the same treatment: a contract, a control run, and a chart that shows the failure mode.
Lessons learned
- Design the chart that would show the failure before running the experiment. If you can't picture it, you don't know what you're testing.
- Keep failing control runs. Run B is now a regression test for the hysteresis logic, and its data is in ES and in an MCAP bag forever.
- Same seed, one changed parameter, a tagged
run_id. That's the whole recipe.