Phase 1: Telemetry before code
Chris's rule for this phase: "Before we build something in code, maybe it should have new telemetry?" So before the first ROS node existed, we wrote down the questions we'd ask of its data.
The working method
Contract → telemetry → node → dashboard → analysis. Every component gets a section in docs/telemetry.md:
- Questions. What will we want to know?
- Signals. Which topics and events answer them?
- Dashboard. Which Kibana panel shows it?
- Analysis. Which script checks it, with pass/fail?
The architecture
 ROS nodes ──topics──▶ es_shipper ──bulk──▶ Elasticsearch ──▶ Kibana
     └─ /mowbot/telemetry (events) ┘                    └──▶ analysis/*.py
     └──▶ ros2 bag (MCAP): raw ground truth, replayable
- Nodes never talk to Elasticsearch. They publish ROS topics. If ES dies, the robot doesn't care.
es_shipperis config-driven (shipper.yaml: which topics, how many Hz). It has a bounded buffer, de-duplicates events by id, and reports its own stats.- Every run gets a
run_id, so Kibana can compare runs side by side. - Analysis results are written back into ES, so pass/fail shows up on the dashboard.
The first real component is a battery: battery_sim drains a noisy simulated pack, and battery_monitor classifies it OK → LOW → CRITICAL with hysteresis.
The telemetry paid for itself on the very first run
Our analysis script fits a line to the battery data and compares it to the configured drain rate. Run smoke-1:
| Drain rate (fraction/min) | 2.0000 | 1.8665 (6.7% off) | FAIL |
Why 6.7% slow? The simulator assumed its 2 Hz timer fires exactly every 0.5 s. Python timers fire late, so simulated time drifted behind real time. This is a classic robotics bug, and it would have been invisible without measurement. The fix is to measure dt from the clock on every tick:
Correction (later the same day)
The fix was right, but this diagnosis was wrong. The timers weren't late. This machine's clock was broken: after the WSL kernel update, the monotonic clock (which timers use) ran ~9% slow, and time sync stepped the wall clock forward ~2.9 s every ~32 s to compensate. See The clock that lied.
| Drain rate (fraction/min) | 2.0000 | 1.9981 (0.1% off) | PASS |
Two more bugs fell out of the same runs:
- Double SIGINT.
timeoutsignals the whole process group, andros2 launchforwards the signal again, so every node died mid-cleanup. Fixed withtimeout --foreground. - An rclpy quirk. A log call site can't change severity between calls (
warningthenerrorfrom the same line crashes the node). Fixed by using two call sites.
That last crash revealed a telemetry gap: the node death showed up only in the console, not in Elasticsearch. It's on the TODO list.
Dashboards as code
The Kibana dashboard lives in git as observability/kibana/mowbot.ndjson. make kibana-import loads it, and make kibana-export saves UI edits back. One gotcha: hand-written saved objects need a typeMigrationVersion, or Kibana replays seven years of migrations on them and crashes.
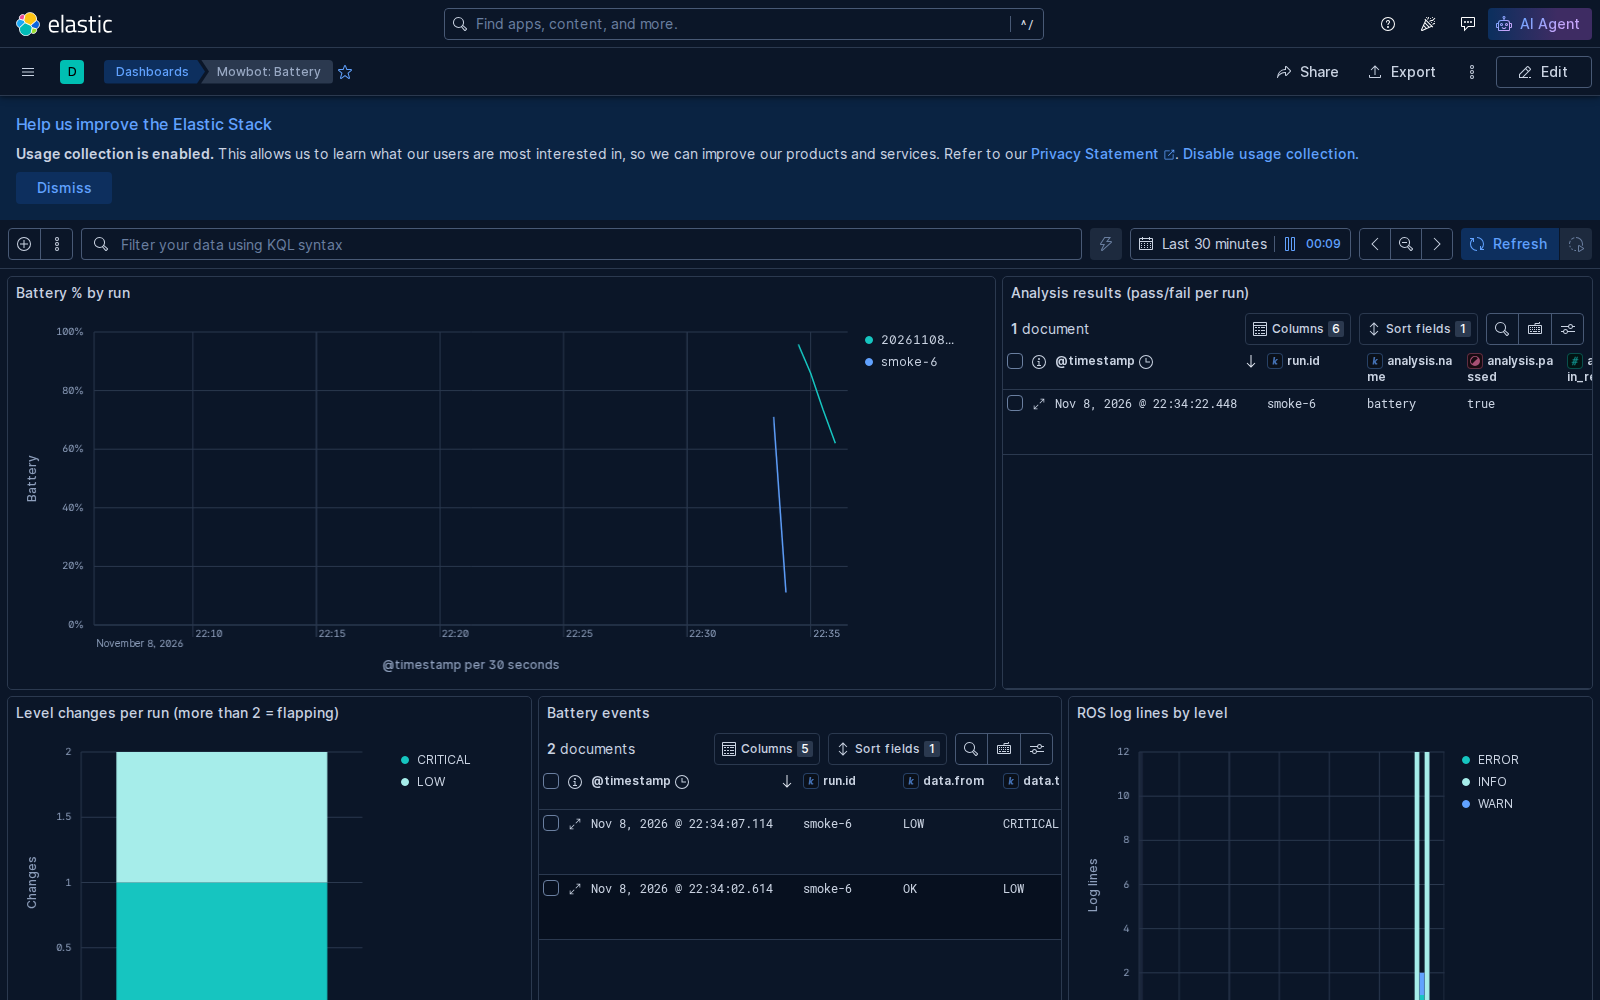
To check the dashboard really renders, and not just that the import returned 200, Claude takes a headless Chromium screenshot (make screenshot, via a pinned Playwright container). Here's the first one, taken while a run was draining live:
Lessons learned
- Never trust a timer's period. Measure elapsed time.
- Write the analysis before trusting the code. Our first "working" simulator was 6.7% wrong.
- An agent that can't see your screen needs a way to look: headless screenshots close the loop.